Human State Estimation
- Byungchul Kim, Jiwon Ryu, Kyu-Jin Cho, “Joint Angle Estimation of a Tendon-Driven Soft Wearable Robot through a Tension and Stroke Measurement,” in Sensors (I.F 3.275, Top 25%), 20.10 (2020): 2852. [pdf] [site]
Necessity and difficulties of human state estimation
When controlling a soft wearable robot, it is necessary to estimate not only the robot state, but also the human state. However, estimating the human/robot state is quite difficult in the soft hand wearable robot due to several reasons as below:
-
It is difficult to attach sufficient number of sensors at the hand due to the size issue. As I explained in the Research Overview page, we wanted to develop the wearble robot that considers both usability and functionality. Therefore we didn`t wanted to use sensors at the wearing part.
-
Some of human state variables are not constant. For instance, the stiffness of human joint is a function of wrist position. Therefore it is hard to figure out using the model-based method.
-
When the robot is under-actuated robot (since we designed the robot using the under-actuation mechanism to consider both usability and functionality), the joint angle of the finger is not determined even the motor stroke is determined; there exist null space in the joint angle space.
-
The elongation of the soft material makes difficult to estimate the kinematic relationship between the transmission and the human joint. For instance, if the robot is actuated using tendon transmission, the distance between the tendon and the joint is important in calculating the moment arm of the tendon. However, when the glove part elongate, it is difficult to estimate the moment arm of the tendon.
In this research, to consider the above uncertainties, I used a data-driven method that identifies both kinematic and stiffness parameters using tension and wire stroke of the actuators. Through kinematic identification, a method is proposed to find the exact joint position as a function of the joint angle. Through stiffness identification, the relationship between the actuation force and the joint angle is obtained using Gaussian Process Regression (GPR).
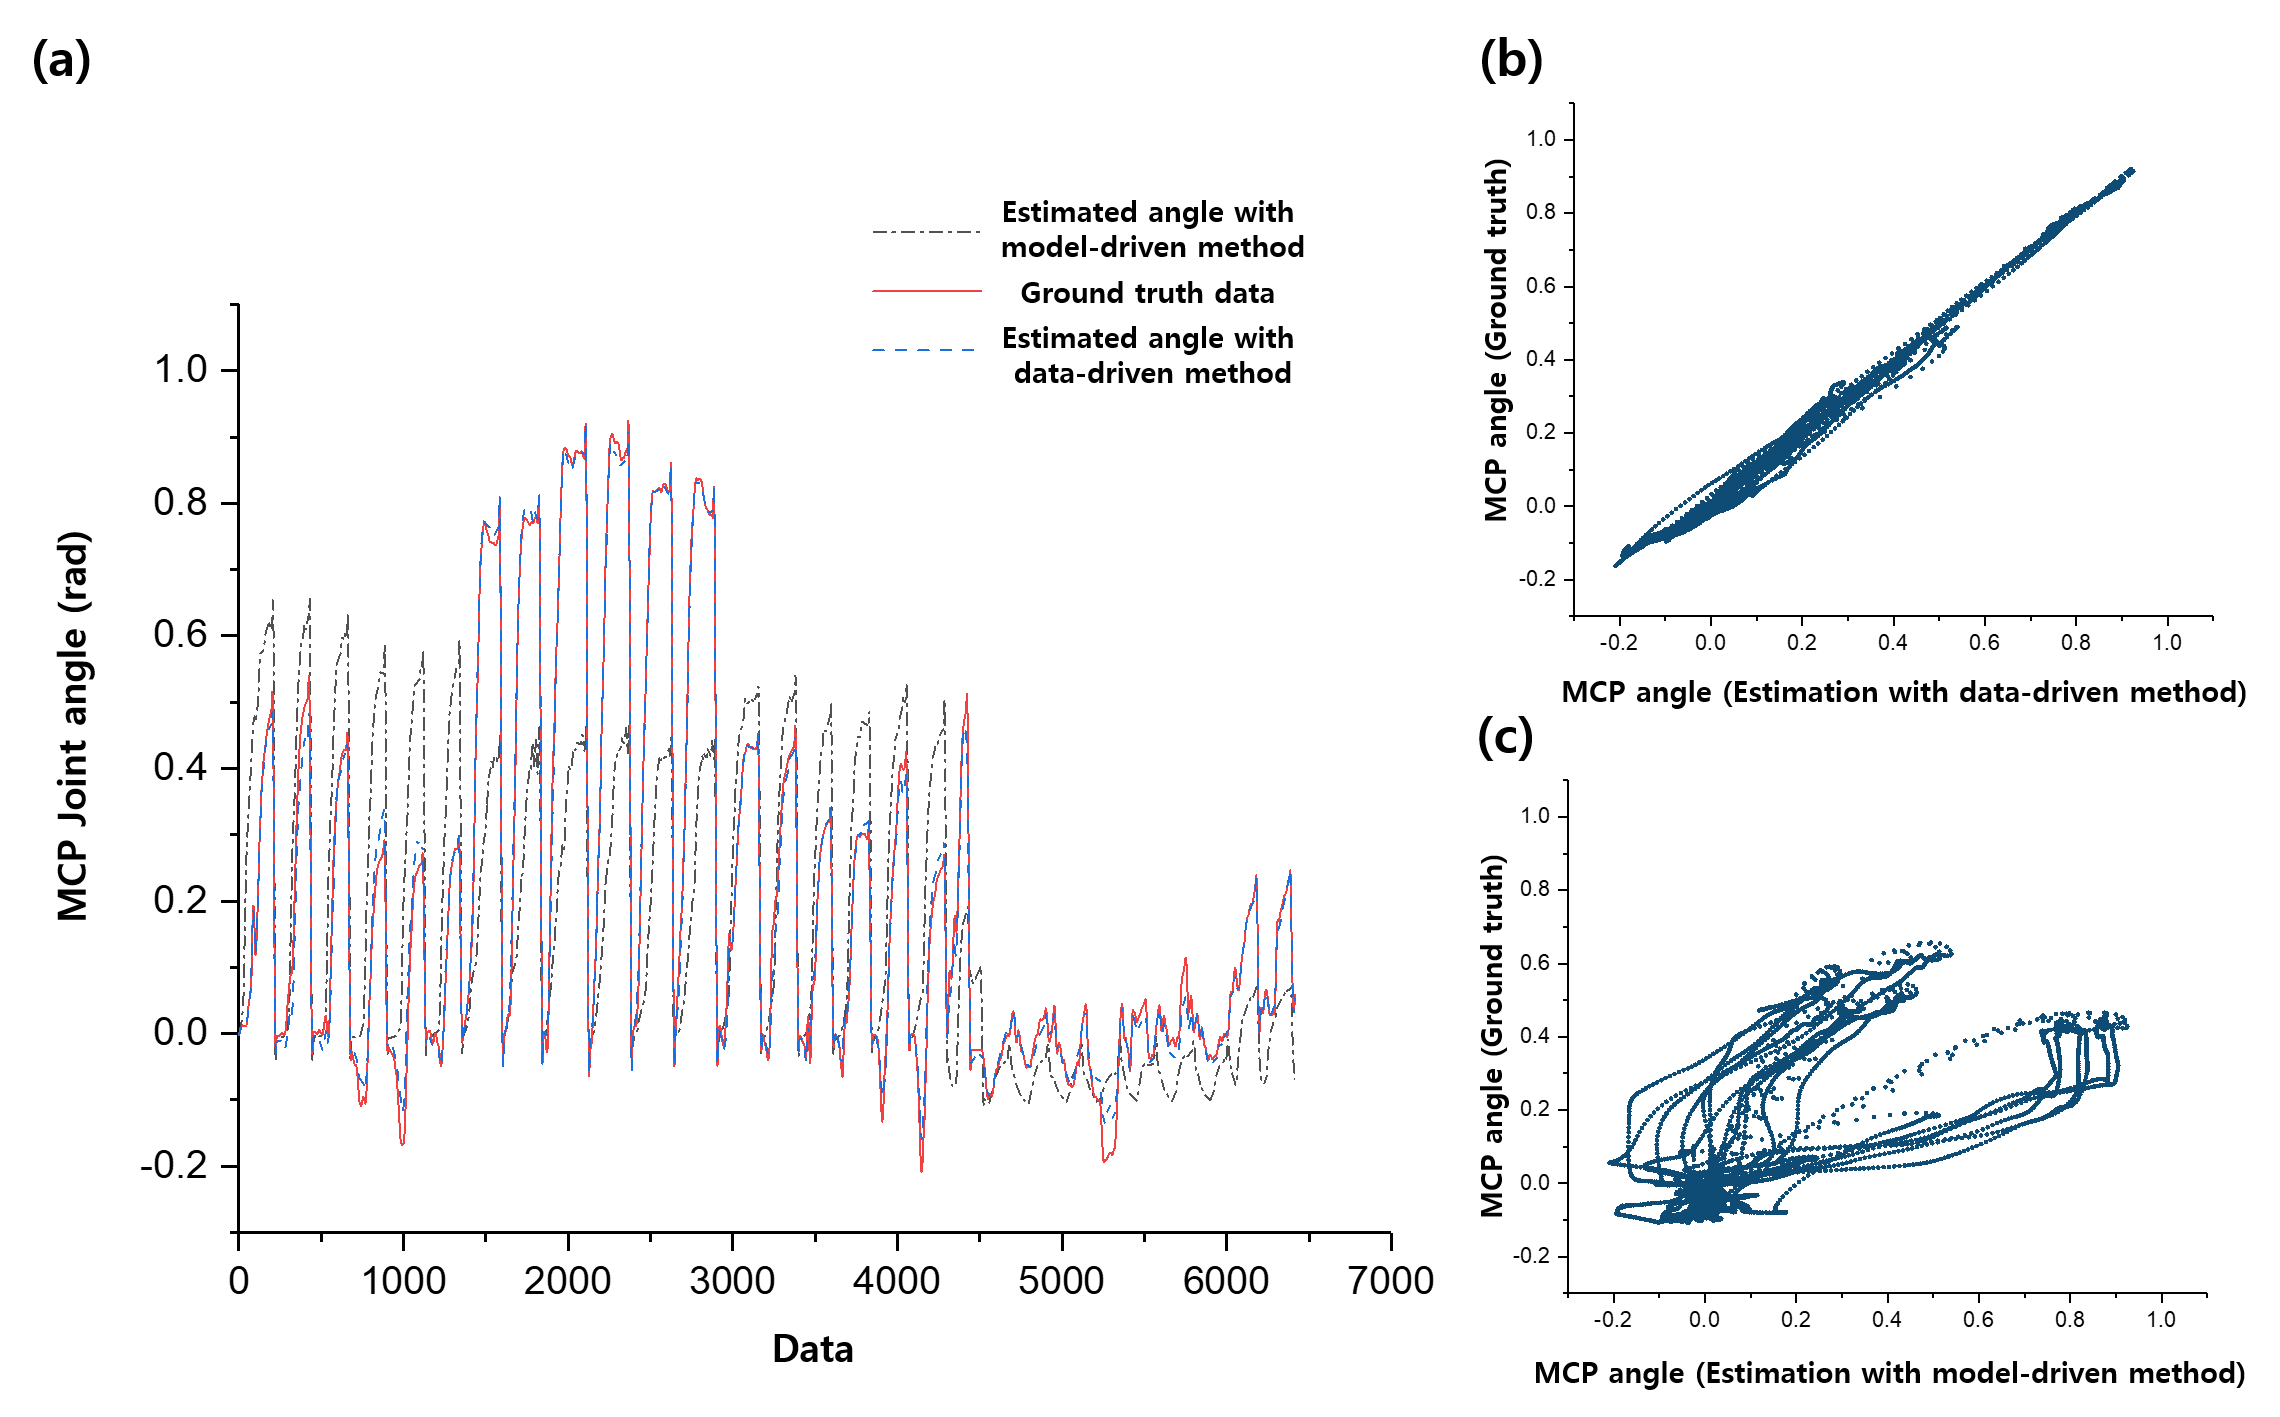
This identification methods have been validated using a specific robot named Exo-Index. The result shown in Fig.1 shows that the estimation result using GPR shows better accuracy compared to the result drived from the model-based method. Details of human state estimation is described in the following sections.
Human State Estimation
The first result examines kinematic system identification, which is designed to find the joint position. The overall experimental setup is depicted in Figure 2.a. Here, three markers are attached to each phalange. In addition, three markers are attached to the back of the hand, resulting in a total of 12 markers attached. Using this experimental setup and a vicon motion capture system, each joint position is obtained as shown in Figure 2 (b)–(d). Here, the position of the joints is described in terms of joint angle because human joints move when the joint angle changes. This is because human joints are not pin joints; human joints are usually called rolling contact joints. In these joints, the bone rotates along the surface, while sustaining the contact with other bones. Here, the position of the joint is expressed with respect to the marker frame, which is attached to the bone in the proximal part of the joint. For example, the position of the DIP joint is expressed with respect to the proximal phalanx.
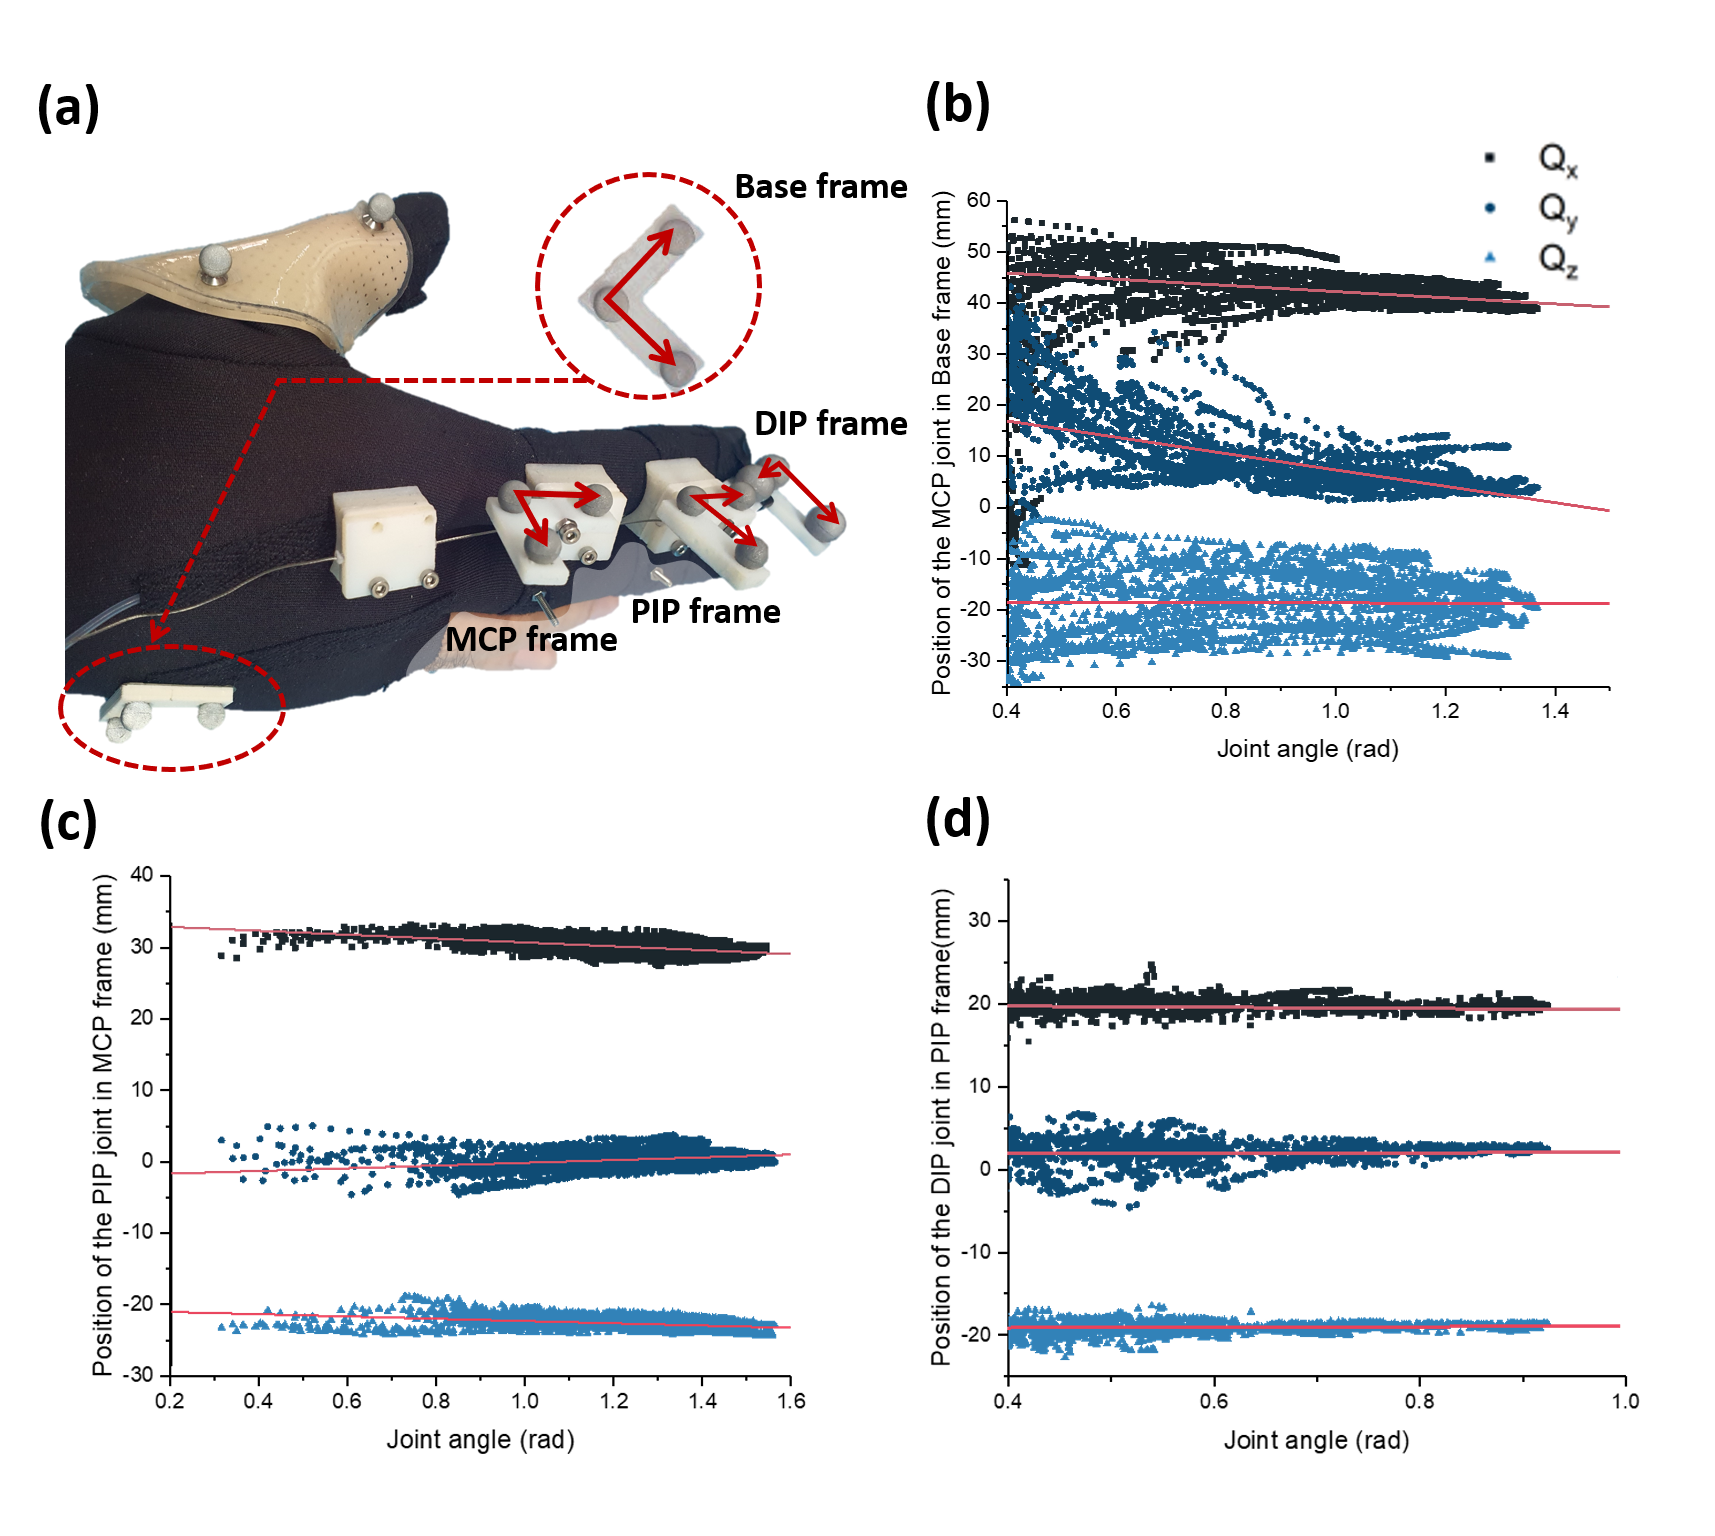
In order to use the measured data in other analysis, linear regression between the joint rotation and the joint position was performed. Table 1 is the result of the linear regression with the data shown in Figure 2. The parameters in the table indicate the gradient and the y-intercept of X, Y, and Z position of each joint with respect to the rotation angles. For example, X value of MCP joint position can be expressed as −6.05 × (joint angle) + 48.78. Here, the X, Y, and Z position of MCP, PIP, and DIP joints are expressed in the Base, MCP, and PIP frame respectively (Figure 2.a). Since the joint positions have a linear relationship with the rotation angles, we can easily estimate the X, Y, and Z values by using the parameters offered in Table 1. From these joint positions, we can also estimate the length of each phalange, which is the size of the vector pointing from one joint to another, by converting all X, Y, and Z values with respect to the Base frame coordinates. Table
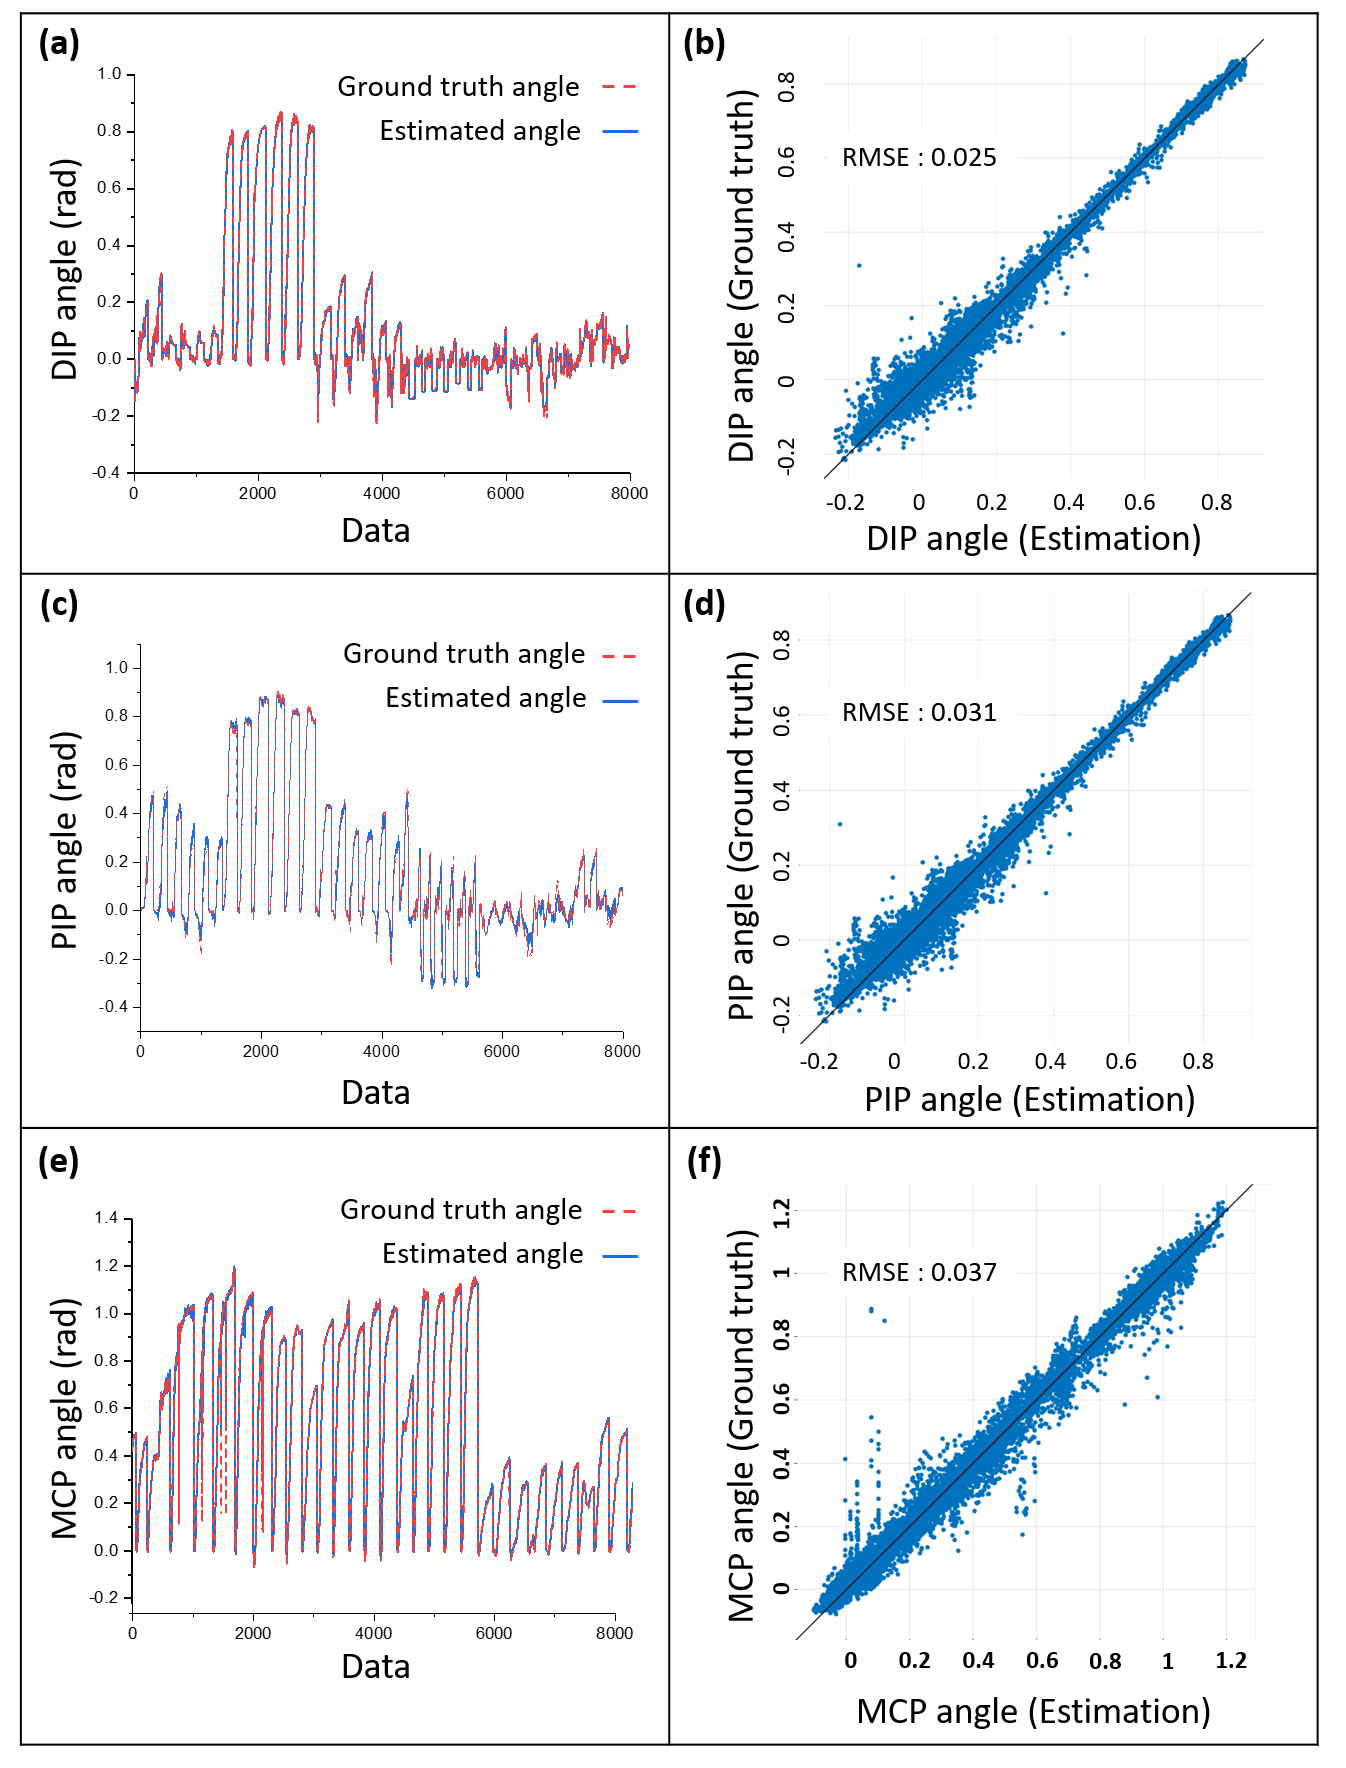
For the stiffness parameter estimation, we performed experiments to obtain the relationship between wire tension, wire stroke and joint angle. In order to determine the relationship, motor encoder, motion data, and loadcell data was measured simultaneously. The relationship was obtained using Gaussian Process Regression; the results are shown in Figure 3. In this figure, (a), (c) and (e) show the tendency of the joint angle along with the regression results. Here, the x axis of the graphs means the number of data; the number of data in x axis means that i-th row of the x axis is i-th data in the data set. In order to show the accuracy of estimation, the relationship between estimated angle and ground truth angle is compared as shown in Figure 3 (b),(d) and (f). As the root mean square error (RMSE) in the figures show, the proposed estimation fits well in the ground truth angle.